Zhou Muzhi: Identify Beijing's path to carbon peak and neutrality by benchmarking against four major metropolises


3. Per capita carbon dioxide emissions in Beijing haven't yet reached the peak
As the economy grows, industrial activities expand, and lifestyles in food, housing and transportation develop, per capita energy consumption will increase, resulting in an increase in per capita carbon dioxide emissions. Generally speaking, when the social and economic development reaches a certain level, carbon dioxide emissions per unit of GDP will be on a downward trajectory, while per capita carbon dioxide emissions will peak later. Therefore, only a continuous decline in per capita carbon dioxide emissions can usher in a turning point. Hence, per capita carbon dioxide emissions are just a key indicator to measure carbon emissions of an economy, and per capita carbon dioxide emissions are a barometer of the real peak of carbon emissions.
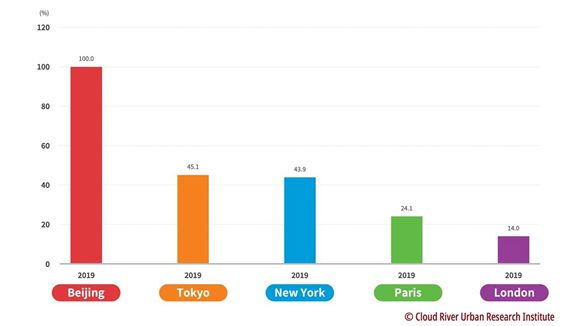
(1) London's per capita carbon dioxide emissions are only 14 percent of Beijing's
Beijing’s per capita carbon dioxide emissions are higher than these four cities. By contrast, per capita carbon dioxide emissions of Tokyo and New York are 45.1 percent and 43.9 percent of that of Beijing, respectively. Per capita carbon dioxide emissions of Paris and London are much lower, only 24.1 and 14 percent of that of Beijing, respectively.
Figure 9 Comparison between Beijing and the 4 major metropolises in terms of per capita carbon emissions
(Share of Beijing's level in 2019)
(2) Beijing's per capita carbon dioxide emissions increase by 120 percent
From 2000 to 2019, Beijing’s per capita carbon dioxide emissions increased by 120 percent, the only city among the five cities that registered positive growth.
Among the four major metropolises, London reported the largest drop in per capita carbon dioxide emission, with a sharp decrease of 55.7 percent. Paris, New York, and Tokyo decreased by 26.1 percent, 14.3 percent and 7.4 percent, respectively.
Figure 10 Change of per capita carbon dioxide emissions in Beijing and the 4 major metropolises (2000-2019)

(3) Which city has lowest share of the national average level in terms of carbon dioxide emissions
Beijing's per capita carbon dioxide emissions are 1.8 times the national level, and it is the only city in the five cities whose per capita carbon dioxide emissions outnumber its national average level.
Per capita carbon emissions of Paris and Tokyo are 62.7 percent and 61.2 percent of their national average levels, respectively. Per capita carbon dioxide emissions of New York and London are 34.5 percent and 29.8 percent of their national average levels, respectively.
Figure 11 Comparison between Beijing and the 4 major metropolises in terms of per capital carbon emissions (share of their national average levels in 2019)

The above analysis reveals that per capita carbon dioxide emissions of the four major metropolises areas are not only lower than their national average levels, but also are significantly declining. This not only reflects their advantages in social and economic development, but also underpins their endeavor to promote carbon neutrality.
Beijing, the Chinese capital, has not yet reached the turning point of per capita carbon emissions. Going forward, Beijing needs to play catch-up to enter the world's top echelon in terms of the industrial structure, urban design, and lifestyle.
(Researchers at the Cloud River Urban Research Institute Kurimoto Kenichi, Zhen Xuehua, and Zhao Jian contributed to data compilation and graphic production in the article.)


- Episode eight of Beautiful Hebei highlights cultural, historical sites
- Beijing launches month-long New Year cultural season
- Zhejiang couple faces extortion probe over alleged vegetable poisoning
- Video of monkeys escaping rain in Guizhou goes viral
- Authorities expose eight cases of illegal land use and ecological damage
- Travel by Shanghai residents to Jinmen, Matsu set to resume